Saturday, June 27, 2009

Fiddler : Web Debugging Software

Posted on/at 12:14 PM by Admin


Dear Web Developers,

”Really, you need to read this article”

I worked for many web based applications and faced debugging problems after deploying or publish the application to hosting server.

also you can use it for the development environment.

some issues: To trace and debug the following:

- Sessions
- Cookies
- Security
- Authentication
- Request Statistics (count-bytes sent-bytes received) 
- Encrypted Query strings
- Web Site Traffic
- Editing CSS file on fly
- Encoding and decoding with many algorithms
- …etc

fiddler Try to find quick start video at www.fiddler2.com

Fiddler is a Web Debugging Proxy which logs all HTTP(S) traffic between your computer and the Internet. Fiddler allows you to inspect all HTTP(S) traffic, set breakpoints, and "fiddle" with incoming or outgoing data. Fiddler includes a powerful event-based scripting subsystem, and can be extended using any .NET language.

Fiddler is freeware and can debug traffic from virtually any application, including Internet Explorer, Mozilla Firefox, Opera, and thousands more.

For documentation and more information  http://www.fiddler2.com/fiddler2/

For download    http://www.fiddler2.com/fiddler2/version.asp

For Developers   http://www.fiddler2.com/Fiddler/dev/

I hope it is helpful.!

Fiddler : Web Debugging Software

Posted on/at 12:12 PM by Admin


Dear Web Developers,

”Really, you need to read this article”

I worked for many web based applications and faced debugging problems after deploying or publish the application to hosting server.

also you can use it for the development environment.

some issues: To trace and debug the following:

- Sessions
- Cookies
- Security
- Authentication
- Request Statistics (count-bytes sent-bytes received) 
- Encrypted Query strings
- Web Site Traffic
- Editing CSS file on fly
- Encoding and decoding with many algorithms
- …etc

fiddler Try to find quick start video at www.fiddler2.com

Fiddler is a Web Debugging Proxy which logs all HTTP(S) traffic between your computer and the Internet. Fiddler allows you to inspect all HTTP(S) traffic, set breakpoints, and "fiddle" with incoming or outgoing data. Fiddler includes a powerful event-based scripting subsystem, and can be extended using any .NET language.

Fiddler is freeware and can debug traffic from virtually any application, including Internet Explorer, Mozilla Firefox, Opera, and thousands more.

For documentation and more information  http://www.fiddler2.com/fiddler2/

For download    http://www.fiddler2.com/fiddler2/version.asp

For Developers   http://www.fiddler2.com/Fiddler/dev/

I hope it is helpful.!

Fiddler : Web Debugging Software

Posted on/at 12:12 PM by Admin


Dear Web Developers,

”Really, you need to read this article”

I worked for many web based applications and faced debugging problems after deploying or publish the application to hosting server.

also you can use it for the development environment.

some issues: To trace and debug the following:

- Sessions
- Cookies
- Security
- Authentication
- Request Statistics (count-bytes sent-bytes received) 
- Encrypted Query strings
- Web Site Traffic
- Editing CSS file on fly
- Encoding and decoding with many algorithms
- …etc

fiddler Try to find quick start video at www.fiddler2.com

Fiddler is a Web Debugging Proxy which logs all HTTP(S) traffic between your computer and the Internet. Fiddler allows you to inspect all HTTP(S) traffic, set breakpoints, and "fiddle" with incoming or outgoing data. Fiddler includes a powerful event-based scripting subsystem, and can be extended using any .NET language.

Fiddler is freeware and can debug traffic from virtually any application, including Internet Explorer, Mozilla Firefox, Opera, and thousands more.

For documentation and more information  http://www.fiddler2.com/fiddler2/

For download    http://www.fiddler2.com/fiddler2/version.asp

For Developers   http://www.fiddler2.com/Fiddler/dev/

I hope it is helpful.!

Saturday, June 13, 2009

Converting Rows to Columns – SQL Server

Posted on/at 12:04 AM by Admin

Introduction:

(This article is dedicated to a good friend and fellow T-SQL warrior, Katrina Wright. We've fought and won many battles together.)

I looked for a definition of what a "Cross Tab" actually is and, after a slight modification, couldn't find a better one than what's in SQL Server 2000 Books Online...

"Sometimes it is necessary to rotate results so that [the data in] columns are presented horizontally and [the data in]rows are presented vertically. This is known as creating a PivotTable®, creating a cross-tab report, or rotating data."

In other words, you can use a Cross Tab or Pivot to convert or transpose information from rows to columns either for reporting or to convert some special long skinny tables known as EAV's or NVP's into a more typical form data.

The purpose of this article is to provide an introduction to Cross Tabs and Pivots and how they can be used to "rotate" data...

Before you say anything...

The reason I'm writing a series of articles on the simple concept of Cross Tabs and Pivots is because of the recent number of requests for this type of information on the SQL Server Central forums... there was a while when not a day went by when two or three such requests were posted each day.

Also, yes, I aware that a lot of this type of "formatting" should be done in the GUI, reporting tool, or maybe even a Spreadsheet. I'm also aware that using EAV/NVP tables isn't considered to be a "best practice". But, like I said about the number of recent number of posts, folks get forced into a corner by their bosses and, if they have to do such a thing, I thought they could use a little help.

Notes of Interest:

I wrote all of the example code and data using Temp Tables just to be safe. Sure, I could have used Table Variables, but they don't really allow for people to do partial runs and they don't all people to look and see what's in the Table Variable after each section. Also, some of the data we'll end up using is a wee bit bigger than what I would normally use a table variable for.

Last but not least, I currently only have SQL Server 2000 and 2005 installed. I indicate which rev each section of code will run on in parenthesis. I'm pretty sure that most of this will work on 2008 and that a good portion of the code for Cross Tabs will also work on 7... but I don't have access to either which means I haven't tested it.

Also, for your convenience, all of the code has been attached in the "Resources" section near the end of the article.

Ok... let's get started...

A simple introduction to Cross Tabs:

The Cross Tab Report example from Books Online is very simple and easy to understand. I've shamelessly borrowed from it to explain this first shot at a Cross Tab.

The Test Data

Basically, the table and data looks like this...

--===== Sample data #1 (#SomeTable1)
--===== Create a test table and some data
CREATE TABLE #SomeTable1
(
Year SMALLINT,
Quarter TINYINT,
Amount DECIMAL(2,1)
)
GO
INSERT INTO #SomeTable1
(Year, Quarter, Amount)
SELECT 2006, 1, 1.1 UNION ALL
SELECT 2006, 2, 1.2 UNION ALL
SELECT 2006, 3, 1.3 UNION ALL
SELECT 2006, 4, 1.4 UNION ALL
SELECT 2007, 1, 2.1 UNION ALL
SELECT 2007, 2, 2.2 UNION ALL
SELECT 2007, 3, 2.3 UNION ALL
SELECT 2007, 4, 2.4 UNION ALL
SELECT 2008, 1, 1.5 UNION ALL
SELECT 2008, 3, 2.3 UNION ALL
SELECT 2008, 4, 1.9
GO

Every row in the code above is unique in that each row contains ALL the information for a given quarter of a given year. Unique data is NOT a requirement for doing Cross Tabs... it just happens to be the condition that the data is in. Also, notice that the 2nd quarter for 2008 is missing.

The goal is to make the data look more like what you would find in a spreadsheet... 1 row for each year with the amounts laid out in columns for each quarter with a grand total for the year. Kind of like this...

... and, notice, we've plugged in a "0" for the missing 2nd quarter of 2008.

Year 1st Qtr 2nd Qtr 3rd Qtr 4th Qtr Total
------ ------- ------- ------- ------- -----
2006 1.1 1.2 1.3 1.4 5.0
2007 2.1 2.2 2.3 2.4 9.0
2008 1.5 0.0 2.3 1.9 5.7

The KEY to Cross Tabs!

Let's start out with the most obvious... we want a Total for each year. This isn't required for Cross Tabs, but it will help demonstrate what the key to making a Cross Tab is.

To make the Total, we need to use the SUM aggregate and a GROUP BY... like this...

--===== Simple sum/total for each year
SELECT Year,
SUM(Amount) AS Total
FROM #SomeTable1
GROUP BY Year
ORDER BY Year

And, that returns the following...

Year Total
------ ----------------------------------------
2006 5.0
2007 9.0
2008 5.7

Not so difficult and really nothing new there. So, how do we "pivot" the data for the Quarter?

Let's do this by the numbers...

1. How many quarters are there per year? Correct, 4.

2. How many columns do we need to show the 4 quarters per year? Correct, 4.

3. How many times do we need the Quarter column to appear in the SELECT list to make it show up 4 times per year? Correct, 4.

4. Now, look at the total column... it gives the GRAND total for each year. What would we have to do to get it to give us, say, the total just for the first quarter for each year? Correct... we need a CASE statement inside the SUM.

Number 4 above is the KEY to doing this Cross Tab... It should be a SUM and it MUST have a CASE to identify the quarter even though each quarter only has 1 value. Yes, if each quarter had more than 1 value, this would still work! If any given quarter is missing, a zero will be substituted.

To emphasize, each column for each quarter is just like the Total column, but it has a CASE statement to trap info only for the correct data for each quarter's column. Here's the code...

--===== Each quarter is just like the total except it has a CASE
-- statement to isolate the amount for each quarter.
SELECT Year,
SUM(CASE WHEN Quarter = 1 THEN Amount ELSE 0 END) AS [1st Qtr],
SUM(CASE WHEN Quarter = 2 THEN Amount ELSE 0 END) AS [2nd Qtr],
SUM(CASE WHEN Quarter = 3 THEN Amount ELSE 0 END) AS [3rd Qtr],
SUM(CASE WHEN Quarter = 4 THEN Amount ELSE 0 END) AS [4th Qtr],
SUM(Amount) AS Total
FROM #SomeTable1
GROUP BY Year

... and that gives us the following result in the text mode (modified so it will fit here)...

Year 1st Qtr 2nd Qtr 3rd Qtr 4th Qtr Total
------ ------- ------- ------- ------- -----
2006 1.1 1.2 1.3 1.4 5.0
2007 2.1 2.2 2.3 2.4 9.0
2008 1.5 .0 2.3 1.9 5.7

Also notice... because there is only one value for each quarter, we could have gotten away with using MAX instead of SUM. Go ahead... try it. We'll use a similar method for normalizing an EAV table in the future.

For most applications, that's good enough. If it's supposed to represent the final output, we might want to make it a little prettier. The STR function inherently right justifies, so we can use that to make the output a little prettier. Please, no hate mail here! I'll be one of the first that formatting of this nature is supposed to be done in the GUI!

--===== We can use the STR function to right justify data and make it prettier.
-- Note that this should really be done by the GUI or Reporting Tool and
-- not in T-SQL
SELECT Year,
STR(SUM(CASE WHEN Quarter = 1 THEN Amount ELSE 0 END),5,1) AS [1st Qtr],
STR(SUM(CASE WHEN Quarter = 2 THEN Amount ELSE 0 END),5,1) AS [2nd Qtr],
STR(SUM(CASE WHEN Quarter = 3 THEN Amount ELSE 0 END),5,1) AS [3rd Qtr],
STR(SUM(CASE WHEN Quarter = 4 THEN Amount ELSE 0 END),5,1) AS [4th Qtr],
STR(SUM(Amount),5,1) AS Total
FROM #SomeTable1
GROUP BY Year

The code above gives us the final result we were looking for...

Year 1st Qtr 2nd Qtr 3rd Qtr 4th Qtr Total
------ ------- ------- ------- ------- -----
2006 1.1 1.2 1.3 1.4 5.0
2007 2.1 2.2 2.3 2.4 9.0
2008 1.5 0.0 2.3 1.9 5.7

Just to emphasize what the very simple KEY to making a Cross Tab is... it's just like making a Total using SUM and Group By, but we've added a CASE statement to isolate the data for each Quarter.

A simple introduction to Pivots:

Microsoft introduced the PIVOT function in SQL Server 2005. It works about the same (has some limitations) as a Cross Tab. Using the same test table we used in the Cross Tab examples above, let's see how to use PIVOT to do the same thing...

--===== Use a Pivot to do the same thing we did with the Cross Tab
SELECT Year, --(4)
[1] AS [1st Qtr], --(3)
[2] AS [2nd Qtr],
[3] AS [3rd Qtr],
[4] AS [4th Qtr],
[1]+[2]+[3]+[4] AS Total --(5)
FROM (SELECT Year, Quarter,Amount FROM #SomeTable1) AS src --(1)
PIVOT (SUM(Amount) FOR Quarter IN ([1],[2],[3],[4])) AS pvt --(2)
ORDER BY Year

Ok... let's break that code down and figure out what each part does... the items below have numbers in the code above so you can more easily see what's going on...

1. The FROM clause is actually a derived table. It very simply contains the columns that we want to use in the cross tab from the source table we want to use the pivot on. It will sometimes work as a normal FROM clause with just the table listed instead of a derived table, but most of the time it will not and is unpredictable when it does work.

2. This is the "Pivot" line. It identifies the aggregate to be used, the column to pivot in the FOR clause, and the list of values that we want to pivot in the IN clause... in this case, the quarter number. Also notice that you must treat those as if they were column names. They must either be put in brackets or double quotes (if the quoted identifier setting is ON).

3. This is the pivoted SELECT list. Notice that you have to bring everything in the IN clause from (2) up to the SELECT list. Aliasing the column names is optional but usually a good thing to do just to make the output obvious.

4. You must also bring Year up as the row identifier in the pivot. Think of this as your "anchor" for the rows.

5. Last but not least, if you want a total for each row in the pivot, you can no longer use just an aggregate. Instead, you must add all the columns together.

When you run the code, you get this...

Year 1st Qtr 2nd Qtr 3rd Qtr 4th Qtr Total
------ ------- ------- ------- ------- -----
2006 1.1 1.2 1.3 1.4 5.0
2007 2.1 2.2 2.3 2.4 9.0
2008 1.5 NULL 2.3 1.9 NULL

Notice the NULL's where there are no values or where a NULL has been added into a total. Remember that anything plus a NULL is still a NULL. All of this occurs because the Pivot doesn't do any substitutions like the Case statements we used in the Cross Tab. To fix this little problem, we have to use COALESCE (or ISNULL) on the columns... every bloody column! So, you end up with code that looks like this...

--===== Converting NULLs to zero's in the Pivot using COALESCE
SELECT Year,
COALESCE([1],0) AS [1st Qtr],
COALESCE([2],0) AS [2nd Qtr],
COALESCE([3],0) AS [3rd Qtr],
COALESCE([4],0) AS [4th Qtr],
COALESCE([1],0) + COALESCE([2] ,0) + COALESCE([3],0) + COALESCE([4],0) AS Total
FROM (SELECT Year, Quarter,Amount FROM #SomeTable1) AS src
PIVOT (SUM(Amount) FOR Quarter IN ([1],[2],[3],[4])) AS pvt
ORDER BY Year

That finally gives us the same result as a Cross Tab sans any right hand justification... again, you'd need to add the STR function to the code to do that.

Year 1st Qtr 2nd Qtr 3rd Qtr 4th Qtr Total
------ ------- ------- ------- ------- -----
2006 1.1 1.2 1.3 1.4 5.0
2007 2.1 2.2 2.3 2.4 9.0
2008 1.5 .0 2.3 1.9 5.7

Readability Comparison

Just for grins, here are both the Cross Tab and the Pivot code real close together so that you can do a comparison...

--===== The Cross Tab example
SELECT Year,
SUM(CASE WHEN Quarter = 1 THEN Amount ELSE 0 END) AS [1st Qtr],
SUM(CASE WHEN Quarter = 2 THEN Amount ELSE 0 END) AS [2nd Qtr],
SUM(CASE WHEN Quarter = 3 THEN Amount ELSE 0 END) AS [3rd Qtr],
SUM(CASE WHEN Quarter = 4 THEN Amount ELSE 0 END) AS [4th Qtr],
SUM(Amount) AS Total
FROM #SomeTable1
GROUP BY Year

--===== The Pivot Example
SELECT Year,
COALESCE([1],0) AS [1st Qtr],
COALESCE([2],0) AS [2nd Qtr],
COALESCE([3],0) AS [3rd Qtr],
COALESCE([4],0) AS [4th Qtr],
COALESCE([1],0) + COALESCE([2] ,0) + COALESCE([3],0) + COALESCE([4],0) AS Total
FROM (SELECT Year, Quarter,Amount FROM #SomeTable1) AS src
PIVOT (SUM(Amount) FOR Quarter IN ([1],[2],[3],[4])) AS pvt
ORDER BY Year

I'm sure that you'll have a preference, but I like the Cross Tab code better for two reasons... the Cross Tab code is simpler, in my eyes... all I have to remember how to do are those very simple Case statements, I only have to list the values of the pivot columns once, and I don't have to use COALESCE anywhere. The second reason is how simple it is to do a row total.

There's actually several other reasons and one of them is performance. We'll get to performance later, but first let's talk about...

Multiple Aggregations In a Cross Tab (or, "The Problem with Pivots")

We're going to do this section backwards from what we've been doing... we're going to cover how to Pivot multiple aggregations before we cover the equivalent Cross Tab.

A "multiple aggregation Pivot" is just that... we want to show two different aggregates in the Pivot something like this (notice both the Qty and Amt columns have been aggregated)...

Company Year Q1Amt Q1Qty Q2Amt Q2Qty Q3Amt Q3Qty Q4Amt Q4Qty TotalAmt TotalQty
------- ------ ----- ----- ----- ----- ----- ----- ----- ----- -------- --------
ABC 2006 1.1 2.2 1.2 2.4 1.3 1.3 1.4 4.2 5.0 10.1
ABC 2007 2.1 2.3 2.2 3.1 2.3 2.1 2.4 1.5 9.0 9.0
ABC 2008 1.5 5.1 0.0 0.0 2.3 3.3 1.9 4.2 5.7 12.6
XYZ 2006 2.1 3.6 2.2 1.8 3.3 2.6 2.4 3.7 10.0 11.7
XYZ 2007 3.1 1.9 1.2 1.2 3.3 4.2 1.4 4.0 9.0 11.3
XYZ 2008 2.5 3.9 3.5 2.1 1.3 3.9 3.9 3.4 11.2 13.3

This type of Pivot is a common request so that both aggregates can be viewed for the same time period at the same time. Otherwise, you'd have two completely separate Pivots and you'd have to visually scan back and forth to make simple comparisons. As you'll see the "Problem with Pivots" is that each Pivot can only aggregate one column. To do something like this using Pivots, you have two use two Pivots.

The Test Data

Before we begin, we need some data to test with...

--===== Sample data #2 (#SomeTable2)
--===== Create a test table and some data
CREATE TABLE #SomeTable2
(
Company VARCHAR(3),
Year SMALLINT,
Quarter TINYINT,
Amount DECIMAL(2,1),
Quantity DECIMAL(2,1)
)
GO
INSERT INTO #SomeTable2
(Company,Year, Quarter, Amount, Quantity)
SELECT 'ABC', 2006, 1, 1.1, 2.2 UNION ALL
SELECT 'ABC', 2006, 2, 1.2, 2.4 UNION ALL
SELECT 'ABC', 2006, 3, 1.3, 1.3 UNION ALL
SELECT 'ABC', 2006, 4, 1.4, 4.2 UNION ALL
SELECT 'ABC', 2007, 1, 2.1, 2.3 UNION ALL
SELECT 'ABC', 2007, 2, 2.2, 3.1 UNION ALL
SELECT 'ABC', 2007, 3, 2.3, 2.1 UNION ALL
SELECT 'ABC', 2007, 4, 2.4, 1.5 UNION ALL
SELECT 'ABC', 2008, 1, 1.5, 5.1 UNION ALL
SELECT 'ABC', 2008, 3, 2.3, 3.3 UNION ALL
SELECT 'ABC', 2008, 4, 1.9, 4.2 UNION ALL
SELECT 'XYZ', 2006, 1, 2.1, 3.6 UNION ALL
SELECT 'XYZ', 2006, 2, 2.2, 1.8 UNION ALL
SELECT 'XYZ', 2006, 3, 3.3, 2.6 UNION ALL
SELECT 'XYZ', 2006, 4, 2.4, 3.7 UNION ALL
SELECT 'XYZ', 2007, 1, 3.1, 1.9 UNION ALL
SELECT 'XYZ', 2007, 2, 1.2, 1.2 UNION ALL
SELECT 'XYZ', 2007, 3, 3.3, 4.2 UNION ALL
SELECT 'XYZ', 2007, 4, 1.4, 4.0 UNION ALL
SELECT 'XYZ', 2008, 1, 2.5, 3.9 UNION ALL
SELECT 'XYZ', 2008, 2, 3.5, 2.1 UNION ALL
SELECT 'XYZ', 2008, 3, 1.3, 3.9 UNION ALL
SELECT 'XYZ', 2008, 4, 3.9, 3.4
GO

The Multi-Aggregate Pivot

Like I said... we'll do the Pivot first this time... then we'll show you how easy it is to do using a Cross Tab.

In order to do a single Pivot, you have to have a derived table and a Pivot clause. The "Problem with Pivots" is that you can only Pivot one aggregate per Pivot clause. If you want to Pivot two aggregates as shown at the beginning of this section, you have to make two Pivots and join them as well as adding the necessary columns to the Select list. You already know how to use a single Pivot... Here's how we would do a double Pivot using the data above...

--===== The "Problem with Pivots" is you need to do one Pivot for each aggregate.
-- This code Pivots the Amt and Qty values by quarter.
SELECT amt.Company,
amt.Year,
COALESCE(amt.[1],0) AS Q1Amt,
COALESCE(qty.[1],0) AS Q1Qty,
COALESCE(amt.[2],0) AS Q2Amt,
COALESCE(qty.[2],0) AS Q2Qty,
COALESCE(amt.[3],0) AS Q3Amt,
COALESCE(qty.[3],0) AS Q3Qty,
COALESCE(amt.[4],0) AS Q4Amt,
COALESCE(qty.[4],0) AS Q4Qty,
COALESCE(amt.[1],0)+COALESCE(amt.[2],0)+COALESCE(amt.[3],0)+COALESCE(amt.[4],0) AS TotalAmt,
COALESCE(qty.[1],0)+COALESCE(qty.[2],0)+COALESCE(qty.[3],0)+COALESCE(qty.[4],0) AS TotalQty
FROM (SELECT Company, Year, Quarter, Amount FROM #SomeTable2) t1
PIVOT (SUM(Amount) FOR Quarter IN ([1], [2], [3], [4])) AS amt
INNER JOIN
(SELECT Company, Year, Quarter, Quantity FROM #SomeTable2) t2
PIVOT (SUM(Quantity) FOR Quarter IN ([1], [2], [3], [4])) AS qty
ON qty.Company = amt.Company
AND qty.Year = amt.Year
ORDER BY amt.Company, amt.Year

I don't know about you, but my personal feeling is that's starting to look a bit complicated and it's starting to be more difficult to read. Certainly, if we tried to convert this to dynamic SQL, you'd have your work cut out for you.

Notice that the FROM clause has two nearly identical derived tables and the only difference in the Pivot clauses are the columns being SUMmed. And, take a look at the row totals in the Select list... thank goodness this example only has 4 columns each for Quantity and Amount.

The Multi-Aggregate Cross Tab

We saw how complicated Multi-Aggregate Pivots can get. And the example above was just for two 4 column aggregates... just image what it might look like for three 12 column aggregates!

Let's see how complicated it might be in a Cross Tab...ready?

--===== Doing multiple aggregations in Cross Tabs is as simple as CPR
-- (CPR = Cut, Paste, Replace). AND, the table is "dipped" only
-- once instead of twice so there are NO JOINS to worry about!
SELECT Company,
Year,
SUM(CASE WHEN Quarter = 1 THEN Amount ELSE 0 END) AS Q1Amt,
SUM(CASE WHEN Quarter = 1 THEN Quantity ELSE 0 END) AS Q1Qty,
SUM(CASE WHEN Quarter = 2 THEN Amount ELSE 0 END) AS Q2Amt,
SUM(CASE WHEN Quarter = 2 THEN Quantity ELSE 0 END) AS Q2Qty,
SUM(CASE WHEN Quarter = 3 THEN Amount ELSE 0 END) AS Q3Amt,
SUM(CASE WHEN Quarter = 3 THEN Quantity ELSE 0 END) AS Q3Qty,
SUM(CASE WHEN Quarter = 4 THEN Amount ELSE 0 END) AS Q4Amt,
SUM(CASE WHEN Quarter = 4 THEN Quantity ELSE 0 END) AS Q4Qty,
SUM(Amount) AS TotalAmt,
SUM(Quantity) AS TotalQty
FROM #SomeTable2
GROUP BY Company, Year
ORDER BY Company, Year

How easy is that!? There're no derived tables... no fancy Pivot clauses... no huge lines of code to make simple row totals... and no joins!. It's a breeze to make using a little CPR (Copy, Paste, Replace).

Go back and compare the incredible simplicity of this Cross Tab with the relatively complex Pivot code to do the same thing. I don't know about you, but I won't be using Pivot to do such a simple thing.

"Pre-Aggregation"

I found something very handy in the past... I call it "Pre-Aggregation" and it can be used on either a Cross Tab or a Pivot.

The general purpose of pre-aggregation is to make it very easy to summarize the data and then format the data for display. Sometimes you'll have some complex aggregations that are a bit difficult or impossible to do when mixed with the rotation in the Select list, so the best thing to do is to do the aggregations as a derived table and then rotate the results. For example, if you want to aggregate dates by month, you'll find it's much easier to pre-aggregate the data using a formula to convert all dates to the first of the month. We'll cover more on that subject in the next article on Cross Tabs.

Pre-aggregation is nothing more than doing the aggregation as part of a derived table and then doing a Cross Tab or Pivot on that result. That's all it is.

You'll find pre-aggregation code for both Cross Tabs and Pivots in the next section of code where you'll also find another really good reason for doing pre-aggregation even if you don't need it to solve complexity...

Performance

Ah yes... what about performance? Just because the code looks simple or complex doesn't necessarily mean faster or slower nor fewer or more resources. Here's the full test code I used... I intentionally did NOT calculate Quarters from the date in the Cross Tabs or the Pivots because I wanted to show you just how much of a performance difference a simple tweak here and there can make... the biggest tweaks I made was the use of pre-aggregation and the use of CTE's...

--===== Create and populate a 1,000,000 row test table.
-- Column "RowNum" has a range of 1 to 1,000,000 unique numbers
-- Column "Company" has a range of "AAA" to "BBB" non-unique 3 character strings
-- Column "Amount has a range of 0.0000 to 9999.9900 non-unique numbers
-- Column "Quantity" has a range of 1 to 50,000 non-unique numbers
-- Column "Date" has a range of >=01/01/2000 and <01/01/2010 non-unique date/times
-- Columns Year and Quarter are the similarly named components of Date
-- Jeff Moden

SELECT TOP 1000000 --<<Look! Change this number for testing different size tables
RowNum = IDENTITY(INT,1,1),
Company = CHAR(ABS(CHECKSUM(NEWID()))%2+65)
+ CHAR(ABS(CHECKSUM(NEWID()))%2+65)
+ CHAR(ABS(CHECKSUM(NEWID()))%2+65),
Amount = CAST(ABS(CHECKSUM(NEWID()))%1000000/100.0 AS MONEY),
Quantity = ABS(CHECKSUM(NEWID()))%50000+1,
Date = CAST(RAND(CHECKSUM(NEWID()))*3653.0+36524.0 AS DATETIME),
Year = CAST(NULL AS SMALLINT),
Quarter = CAST(NULL AS TINYINT)
INTO #SomeTable3
FROM Master.sys.SysColumns t1
CROSS JOIN
Master.sys.SysColumns t2

--===== Fill in the Year and Quarter columns from the Date column
UPDATE #SomeTable3
SET Year = DATEPART(yy,Date),
Quarter = DATEPART(qq,Date)

--===== A table is not properly formed unless a Primary Key has been assigned
-- Takes about 1 second to execute.
ALTER TABLE #SomeTable3
ADD PRIMARY KEY CLUSTERED (RowNum)

CREATE NONCLUSTERED INDEX IX_#SomeTable3_Cover1
ON dbo.#SomeTable3 (Company, Year)
INCLUDE (Amount, Quantity, Quarter)
GO
SET STATISTICS TIME OFF
SET STATISTICS IO OFF
GO
---------------------------------------------------------------------------------------------------
--===== "Normal" Cross Tab
PRINT REPLICATE('=',100)
PRINT '=============== "Normal" Cross Tab ==============='
SET STATISTICS IO ON
SET STATISTICS TIME ON

SELECT Company,
Year,
SUM(CASE WHEN Quarter = 1 THEN Amount ELSE 0 END) AS Q1Amt,
SUM(CASE WHEN Quarter = 1 THEN Quantity ELSE 0 END) AS Q1Qty,
SUM(CASE WHEN Quarter = 2 THEN Amount ELSE 0 END) AS Q2Amt,
SUM(CASE WHEN Quarter = 2 THEN Quantity ELSE 0 END) AS Q2Qty,
SUM(CASE WHEN Quarter = 3 THEN Amount ELSE 0 END) AS Q3Amt,
SUM(CASE WHEN Quarter = 3 THEN Quantity ELSE 0 END) AS Q3Qty,
SUM(CASE WHEN Quarter = 4 THEN Amount ELSE 0 END) AS Q4Amt,
SUM(CASE WHEN Quarter = 4 THEN Quantity ELSE 0 END) AS Q4Qty,
SUM(Amount) AS TotalAmt,
SUM(Quantity) AS TotalQty
FROM #SomeTable3
GROUP BY Company, Year
ORDER BY Company, Year

SET STATISTICS TIME OFF
SET STATISTICS IO OFF
---------------------------------------------------------------------------------------------------
--===== "Normal" Pivot
PRINT REPLICATE('=',100)
PRINT '=============== "Normal" Pivot ==============='
SET STATISTICS IO ON
SET STATISTICS TIME ON

SELECT amt.Company,
amt.Year,
COALESCE(amt.[1],0) AS Q1Amt,
COALESCE(qty.[1],0) AS Q1Qty,
COALESCE(amt.[2],0) AS Q2Amt,
COALESCE(qty.[2],0) AS Q2Qty,
COALESCE(amt.[3],0) AS Q3Amt,
COALESCE(qty.[3],0) AS Q3Qty,
COALESCE(amt.[4],0) AS Q4Amt,
COALESCE(qty.[4],0) AS Q5Qty,
COALESCE(amt.[1],0)+COALESCE(amt.[2],0)+COALESCE(amt.[3],0)+COALESCE(amt.[4],0) AS TotalAmt,
COALESCE(qty.[1],0)+COALESCE(qty.[2],0)+COALESCE(qty.[3],0)+COALESCE(qty.[4],0) AS TotalQty
FROM (SELECT Company, Year, Quarter, Amount FROM #SomeTable3) t1
PIVOT (SUM(Amount) FOR Quarter IN ([1], [2], [3], [4])) AS amt
INNER JOIN
(SELECT Company, Year, Quarter, Quantity FROM #SomeTable3) t2
PIVOT (SUM(Quantity) FOR Quarter IN ([1], [2], [3], [4])) AS qty
ON qty.Company = amt.Company
AND qty.Year = amt.Year
ORDER BY amt.Company, amt.Year

SET STATISTICS TIME OFF
SET STATISTICS IO OFF
---------------------------------------------------------------------------------------------------
--===== "Pre-aggregated" Cross Tab
PRINT REPLICATE('=',100)
PRINT '=============== "Pre-aggregated" Cross Tab ==============='
SET STATISTICS IO ON
SET STATISTICS TIME ON

SELECT Company,
Year,
SUM(CASE WHEN Quarter = 1 THEN Amount ELSE 0 END) AS Q1Amt,
SUM(CASE WHEN Quarter = 1 THEN Quantity ELSE 0 END) AS Q1Qty,
SUM(CASE WHEN Quarter = 2 THEN Amount ELSE 0 END) AS Q2Amt,
SUM(CASE WHEN Quarter = 2 THEN Quantity ELSE 0 END) AS Q2Qty,
SUM(CASE WHEN Quarter = 3 THEN Amount ELSE 0 END) AS Q3Amt,
SUM(CASE WHEN Quarter = 3 THEN Quantity ELSE 0 END) AS Q3Qty,
SUM(CASE WHEN Quarter = 4 THEN Amount ELSE 0 END) AS Q4Amt,
SUM(CASE WHEN Quarter = 4 THEN Quantity ELSE 0 END) AS Q4Qty,
SUM(Amount) AS TotalAmt,
SUM(Quantity) AS TotalQty
FROM (SELECT Company,Year,Quarter,SUM(Amount) AS Amount,SUM(Quantity) AS Quantity
FROM #SomeTable3 GROUP BY Company,Year,Quarter) d
GROUP BY Company, Year
ORDER BY Company, Year

SET STATISTICS TIME OFF
SET STATISTICS IO OFF
---------------------------------------------------------------------------------------------------
--===== "Pre-aggregated" Pivot
PRINT REPLICATE('=',100)
PRINT '=============== "Pre-aggregated" Pivot ==============='
SET STATISTICS IO ON
SET STATISTICS TIME ON

SELECT amt.Company,
amt.Year,
COALESCE(amt.[1],0) AS Q1Amt,
COALESCE(qty.[1],0) AS Q1Qty,
COALESCE(amt.[2],0) AS Q2Amt,
COALESCE(qty.[2],0) AS Q2Qty,
COALESCE(amt.[3],0) AS Q3Amt,
COALESCE(qty.[3],0) AS Q3Qty,
COALESCE(amt.[4],0) AS Q4Amt,
COALESCE(qty.[4],0) AS Q5Qty,
COALESCE(amt.[1],0)+COALESCE(amt.[2],0)+COALESCE(amt.[3],0)+COALESCE(amt.[4],0) AS TotalAmt,
COALESCE(qty.[1],0)+COALESCE(qty.[2],0)+COALESCE(qty.[3],0)+COALESCE(qty.[4],0) AS TotalQty
FROM (SELECT Company, Year, Quarter, SUM(Amount) AS Amount FROM #SomeTable3 GROUP BY Company, Year, Quarter) t1
PIVOT (SUM(Amount) FOR Quarter IN ([1], [2], [3], [4])) AS amt
INNER JOIN
(SELECT Company, Year, Quarter, SUM(Quantity) AS Quantity FROM #SomeTable3 GROUP BY Company, Year, Quarter) t2
PIVOT (SUM(Quantity) FOR Quarter IN ([1], [2], [3], [4])) AS qty
ON qty.Company = amt.Company
AND qty.Year = amt.Year
ORDER BY amt.Company, amt.Year

SET STATISTICS TIME OFF
SET STATISTICS IO OFF
---------------------------------------------------------------------------------------------------
--===== "Pre-aggregated" Cross Tab with CTE
PRINT REPLICATE('=',100)
PRINT '=============== "Pre-aggregated" Cross Tab with CTE ==============='
SET STATISTICS IO ON
SET STATISTICS TIME ON

;WITH
ctePreAgg AS
(SELECT Company,Year,Quarter,SUM(Amount) AS Amount,SUM(Quantity) AS Quantity
FROM #SomeTable3
GROUP BY Company,Year,Quarter
)
SELECT Company,
Year,
SUM(CASE WHEN Quarter = 1 THEN Amount ELSE 0 END) AS Q1Amt,
SUM(CASE WHEN Quarter = 1 THEN Quantity ELSE 0 END) AS Q1Qty,
SUM(CASE WHEN Quarter = 2 THEN Amount ELSE 0 END) AS Q2Amt,
SUM(CASE WHEN Quarter = 2 THEN Quantity ELSE 0 END) AS Q2Qty,
SUM(CASE WHEN Quarter = 3 THEN Amount ELSE 0 END) AS Q3Amt,
SUM(CASE WHEN Quarter = 3 THEN Quantity ELSE 0 END) AS Q3Qty,
SUM(CASE WHEN Quarter = 4 THEN Amount ELSE 0 END) AS Q4Amt,
SUM(CASE WHEN Quarter = 4 THEN Quantity ELSE 0 END) AS Q4Qty,
SUM(Amount) AS TotalAmt,
SUM(Quantity) AS TotalQty
FROM ctePreAgg
GROUP BY Company, Year
ORDER BY Company, Year

SET STATISTICS TIME OFF
SET STATISTICS IO OFF
---------------------------------------------------------------------------------------------------
--===== "Pre-aggregated" Pivot with CTE
PRINT REPLICATE('=',100)
PRINT '=============== "Pre-aggregated" Pivot with CTE ==============='
SET STATISTICS IO ON
SET STATISTICS TIME ON

;WITH
ctePreAgg AS
(SELECT Company,Year,Quarter,SUM(Amount) AS Amount,SUM(Quantity) AS Quantity
FROM #SomeTable3
GROUP BY Company,Year,Quarter
)
SELECT amt.Company,
amt.Year,
COALESCE(amt.[1],0) AS Q1Amt,
COALESCE(qty.[1],0) AS Q1Qty,
COALESCE(amt.[2],0) AS Q2Amt,
COALESCE(qty.[2],0) AS Q2Qty,
COALESCE(amt.[3],0) AS Q3Amt,
COALESCE(qty.[3],0) AS Q3Qty,
COALESCE(amt.[4],0) AS Q4Amt,
COALESCE(qty.[4],0) AS Q5Qty,
COALESCE(amt.[1],0)+COALESCE(amt.[2],0)+COALESCE(amt.[3],0)+COALESCE(amt.[4],0) AS TotalAmt,
COALESCE(qty.[1],0)+COALESCE(qty.[2],0)+COALESCE(qty.[3],0)+COALESCE(qty.[4],0) AS TotalQty
FROM (SELECT Company, Year, Quarter, Amount FROM ctePreAgg) AS t1
PIVOT (SUM(Amount) FOR Quarter IN ([1], [2], [3], [4])) AS amt
INNER JOIN
(SELECT Company, Year, Quarter, Quantity FROM ctePreAgg) AS t2
PIVOT (SUM(Quantity) FOR Quarter IN ([1], [2], [3], [4])) AS qty
ON qty.Company = amt.Company
AND qty.Year = amt.Year
ORDER BY amt.Company, amt.Year

SET STATISTICS TIME OFF
SET STATISTICS IO OFF

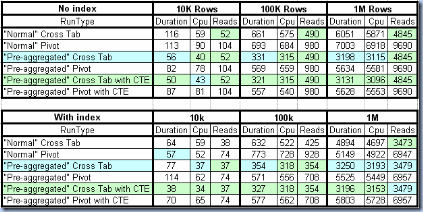
The test code was executed 10 times each for 10k, 100k, and 1 million rows both with and without the index created at the beginning of the code. The averaged results, calculated from a profiler table (not included in the code), are fascinating. The light green cells indicate the fastest run times or the least number of reads. The light blue indicate the second place for the same thing...
clip_image001

Notice that even for "normal" Cross Tabs and Pivots that the only place a Pivot wins in any category is in the paltry 10k row test. The Cross Tab wins everywhere else. That's good news for SQL Server 2000 users because you won't want to change your code if and when you upgrade to SQL Server 2005. Using CTE's helps a bit but not as much as pre-aggregation on the larger row counts does. Again, that's good news for SQL Server 2000 users.

Review

In this article, we learned the basis of how to change rows to columns using both Cross Tabs and Pivot. We've discovered that Cross Tabs are nothing more than simple aggregations that have a built in selection condition in the form of a simple Case statement. We've seen how to use a Pivot to do the same thing as a Cross Tab and, in the process, discovered that they're a bit more complicated to create, read, and understand especially when compared to the simplicity of the Cross Tab code. We've been introduced to the concept of "pre-aggregation and the fact that pre-aggregation can make more complex aggregations both easier to read and to contrive. Through testing, we've found that the Cross Tab beats Pivot code in all but the smallest of tables. Through that same testing, we've also found that pre-aggregation adds a substantial performance gain in all but the smallest of tables.

Last but certainly not least, we've discovered that there's no reason to rewrite properly written Cross Tabs to become Pivots when shifting from SQL Server 2000 to SQL Server 2005. To do so would actually cause a negative impact to performance most of the time.

Sunday, May 31, 2009

Setting Up Delegation for Linked Servers

Posted on/at 12:53 AM by Admin


By Gregory A. Larsen

If you are like most, you probably have looked into using Windows Authentication as a method to authenticate users to SQL Server 2005. Windows Authentication is the preferred and more secure method of connecting to SQL Server. If your goal is to use Windows authentication for everything then under some situations it does present some challenges. One of those challenges is setting up linked servers to impersonate the local login when connecting to a linked server. This article will discuss how to set up delegation on your SQL Server instances so you can use the impersonate options when setting up the security properties of linked server definitions.

What is Delegation?

Delegation is when a middle tier server, impersonates the client login when connecting to a backend server. When users connect to a backend server through a middle server this is commonly called a double hop. In order to make Windows Authentication work in this situation the middle tier server need to impersonate the user when connecting to the backend machine. This impersonation allows the backend machine to know the login of the original user so queries can be run in the security context of the original user. For the purposes of this article, this means that when a client connects to SQL Server, the client login will be impersonated when using a linked server to connect to a backend SQL Server machine.

Machine Configuration

For the purpose of this article, I also need to provide you with a layout of the computer topology for this article. To help convey the hardware architecture for my delegation examples below please review the following diagram.

Here there are three machine involved, one user machine and two servers. The user machine is referred to as “client” and requires that the user needs to logon to the network with a domain account. For the purpose of this article, assume that user is “SDS\GREG” and the user connects to SERVER1 using windows authentication. The application on the client machine needs to be able to run a number of queries that retrieves data from both SERVER1 and SERVER2. Any time the application retrieves data from SERVER2 it will be done using a linked server from SERVER1. Each server is running a single default instance of SQL Server. All of the SQL Server services for SERVER1 instance are running under the domain account named SERVER1_DF, and all services on the SERVER2 instance are running under the SERVER2_DF domain account.

It is worth mentioning here that one problem I encountered while setting up delegation was associated with the account I used to run my SQL Server services. When I ran my SQL Server Services under the computer account, delegation wouldn’t work. You need to make sure your services are running under an account that is different from the machine name, hence the reason my service account names are <machine name>_DF. The DF stands for default instance.

How to Setup Delegation

The setup of delegation is not complicated, but does require a number of steps. Keep in mind the method I will show you is specific to my SQL Server setup. If your setup is different, additional and/or different steps might be needed.

One of the first things you need to do is make sure all service and user accounts involved in your delegation situation are allowed to be delegated. Active directory definitions for accounts identifies whether or not an account can be delegated. Delegation is controlled via a check box within the “Account Options” section of the “Account” tab on the domain account properties window. The check box “Account is sensitive and cannot be delegated” needs to be unchecked. The following screen shot shows this for user “SDS\GREG”:

You need to make sure all accounts that will be using linked servers have the “Account options” set appropriately to allow their account to be delegated. In my example, you need to make sure both SERVER1_DF and SERVER2_DF have this check box, unchecked.

The next step to setting up delegation is to establish a Server Principle Name (SPN) entry for each SQL Server instance. To do this you use the SETSPN tool. This tool is part of the windows support tools, which can be downloaded from Microsoft for your version of Windows. For my two servers in the above diagram I ran the following set of SETSPN commands from the command prompt. Keep in mind these commands need to be executed under an account that has domain administration permissions.

SETSPN -A MSSQLSvc/SERVER1:1433 SDS\SERVER1_DF
SETSPN -A MSSQLSvc/SERVER1.SDS.COM:1433 SDS\SERVER1_DF


SETSPN -A MSSQLSvc/SERVER2:1433 SDS\SERVER2_DF
SETSPN -A MSSQLSvc/SERVER2.SDS.COM:1433 SDS\SERVER2_DF


Here the first two commands define SPN’s for SERVER1 and the second two commands for SERVER2. Note the first SPN command in each set registers the SPN by referencing just the machine name, and the second one identifies the fully qualified domain name of the server. To verify the SPNs are registered correctly for a service account you can run the following command:


SETSPN –L SDS\SERVER1_DF


This command will list all the SPNs associated with domain account “SDS\SERVER1_DF”.


The next step in setting up delegation is to make sure the SQL Server service accounts are set up so they can perform delegation. To do this you set the appropriate delegation options for the SQL Server accounts under the “Delegation” tab when reviewing the domain account properties. Note the delegation tab will not be displayed for an account until the SETSPN command for that account has been established. So, in my example I need to set the delegation options for SERVER1_DF and SERVER2_DF accounts. There are two different options you can pick when setting the delegation options for an account, constrained and un-constrained. I decided to use constrained delegation for my set up, since that minimizes the number of services that can perform delegation. Below is a screen shot of the options I used to for setting up my SERVER1_DF services account:


Here you can see that I select “Use Kerberos only” radio button and then specified the specific service type that would be doing the delegation. For SQL Server the service type is “MSSQLSvc”. I also specified the computer name “SERVER1” and the port that SQL Server is listening on.


You also need to verify that the computer account within Active directory is also set up to support delegation. To do this edit the computer properties in Active directory to look like this:


Here I have set up my SERVER1 machine to delegate using Kerberos, just as I did with the service account above.


Lastly, you need to verify that the local security policies on the middle tier server are set up to allow delegation. This is done by using the “Local Security Policy” tool under “Administrative tools”. Expand the “Local Policy” item under the “Security section”, and then expand the “User rights assignment”. Then double click on the “Impersonate a client after authentication” item to modify the properties. Use the “Add Users of Groups…” button to add the account that the SQL Server services are running under. In my case that would be “SERVER1_DF”. After I added my account the “Impersonate a client after authentication” properties looks like this:


Here, I have added account “SDS\SERVER1_DF” to the local security policies on SERVER1, my middle tier server.


Testing Delegation


Once you have set up your accounts and machines you need to verify that delegation works using linked servers. To do this, log on to a client machine using a windows account. Make sure the account you use has a login established on your middle tier and backend SQL Server machines. Once logged on to your client machine, connect to your middle tier SQL Server machine. I normally do this using a client machine that has SQL Server Management studio installed. When I am connected, I then open a new query window and verify that I have connected to the middle tier server via Kerberos. To do this I issue the following command:


select auth_scheme from sys.dm_exec_connections
where session_id = @@SPID


If the displayed “auth_scheme” is “KERBEROS” then I know I have successfully connected to the middle tier server using Kerberos authentication method. If “NTLM” is displayed for the “auth_scheme” then I know I did not successfully set up my middle tier server for delegation, and I go back to make sure I didn’t miss a step.


Once I have successfully verified that I am connected to the middle tier server using Kerberos, then the final test I do is to submit a linked server request to my backend server. In my case, I would be submitting a linked server request to SERVER2. So for me to verify my delegation is set up I would issue the following command:


select name from SERVER2.master.sys.servers where server_id = 0


If delegation is set up correctly this command should return the name “SERVER2”. If delegation is not set up, an authentication error will be displayed.


Troubleshooting Delegation Setup


It isn’t extremely straightforward to set up delegation. In fact, I had a number of failed attempts before I successfully set up my first set of SQL Server machines for delegation. To help me troubleshoot my delegation setup, I used the following document:


http://www.microsoft.com/technet/prodtechnol/windowsserver2003/technologies/security/tkerbdel.mspx


This document walks through a number of different situations and provides steps for verifying that your delegation setup is correct.


Conclusion:


Being able to use windows authentication for linked servers provides a more secure architecture then defining login mappings. It also minimizes the work needed to set up and maintain linked server definitions. Setting up delegation does require a number of steps to successfully set up your servers, and possibly some troubleshooting but it is worth the effort. This article provides you with the steps and tools necessary to set up and troubleshoot setting up your SQL Server environment to use delegation.

Dealing with Comma Delimited Strings

Posted on/at 12:51 AM by Admin


By Gregory A. Larsen

When dealing with data you come across many different situations. In this article I will discuss how to deal with a few situations that involve working with comma separated data. Comma separated data can come in many forms. It can be input, a text string stored in a column, or a number of other situations. This article will deal with two different comma separated data situations.

Displaying Multiple Records from a Single Record

In this situation there is a column in a table that holds a series of values that are separated by a comma. For each record, the comma separated column needs to be parsed apart and returned as separate row. So the final output record set will contain multiple records for a given single record stored in a SQL Server table.

To demonstrate this I will run the following code:

set nocount on 
-- Create Example1 Table and Populate with Data
create table Example1 (Id int,
TypeOfValues varchar(20),
ColumnOfValues char(30))
CREATE UNIQUE CLUSTERED INDEX ID_ind
ON Example1(Id)
WITH IGNORE_DUP_KEY

insert into Example1 values(1, 'Colors','Red,Green,Blue,Black,White')
insert into Example1 values(2, 'Models','Normal,Deluxe,Super Deluxe')
insert into Example1 values(3, 'Years','2004,2005,2006')
-- Create Number Table
SELECT IDENTITY(INT) AS Number
INTO Numbers
FROM sysobjects s1
CROSS JOIN sysobjects s2

CREATE UNIQUE CLUSTERED INDEX Number_ind
ON Numbers(number)
WITH IGNORE_DUP_KEY
SELECT Id,
TypeOfValues,
SUBSTRING( ColumnOfValues, Number,
CHARINDEX( ',', ColumnofValues + ',', Number ) - Number ) as Value
FROM Example1
INNER JOIN Numbers
ON SUBSTRING( ',' + ColumnOfValues, Number, 1 ) = ','
where Number <= Len(ColumnOfValues) + 1
drop table Example1
drop table Numbers


When I run this code on my server I get the following results:


Id          TypeOfValues         Value
----------- -------------------- ------------------------------
1 Colors Red
1 Colors Green
1 Colors Blue
1 Colors Black
1 Colors White
2 Models Normal
2 Models Deluxe
2 Models Super Deluxe
3 Years 2004
3 Years 2005
3 Years 2006


Here you can see that for each “Id” there are multiple rows. Each row has only one value from the comma delimited column “ColumnOfValues”. To understand how this was accomplished let’s review my code.


First I create the table “Example1”, and then populate it with three different records. Each record contains a type column (“TypeOfValues”) and a value column (“ColumnOfValues”) which contains a comma delimited string of with different values. The “ColumnOfValues” column will be the column that that is parsed apart to create multiple records for each record in the Example1 table.


Next I create a Numbers table, by joining sysobjects to itself. This table will contain a series of sequential numbers starting from 1.


Finally the SELECT statement parses apart the “ColumnOfValue” column into multiple records. It does this by using the Numbers table to identify the offset of each comma. This is done by joining the Numbers table to a single character substring of the “ColumnOfValues” column, starting with the first character, then second, and so on. Whenever the join condition finds a comma, it uses the Number value to identify the starting point of the SUBSTRING and CHARINDEX functions, so these functions can extract a single character string of value out of the “ColumnOfValues” columns. To increase the performance of this statement a WHERE clause is added to reduce the number of rows from the Numbers table that needs to be joined to the Example1 table.


Displaying a Single Record with a Comma Separated Column from Multiple Records


Some times you might have a table that contains a series of records that contain a key and a value column. In your table there might be many different values for a given key. This example will show you how to collapse all those key value pairs into a single record. That single record will contain a unique key followed by a comma separate string composed of all the values associated with the key.


Here is an example of the table I will be using that contains a key (id_no) and a value (item):


id_no       item
----------- --------------------
1 Skiing
1 Diving
2 Diving
2 Skiing
2 Hunting
2 Fishing
4 Sailing
4 Skiing
5 Skiing


In this table for each “id_no” there is one or more “items” identified. Each record contains a single “item” value. I will use the code listed below to populate the above table:


-- create example table
CREATE TABLE Example2(id_no int not null, item varchar(20) not null)
-- populate the example table
INSERT INTO Example2 VALUES (1, 'Skiing')
INSERT INTO Example2 VALUES (1, 'Diving')
INSERT INTO Example2 VALUES (2, 'Diving')
INSERT INTO Example2 VALUES (2, 'Skiing')
INSERT INTO Example2 VALUES (2, 'Hunting')
INSERT INTO Example2 VALUES (2, 'Fishing')
INSERT INTO Example2 VALUES (4, 'Sailing')
INSERT INTO Example2 VALUES (4, 'Skiing')
INSERT INTO Example2 VALUES (5, 'Skiing')


The next code snippet returns a record set that contains a single record for each “id_no”, followed by a comma delimited string that concatenates each “item” value together into a single column value:


-- declare local variables
declare @p varchar(1000)
declare @i char(5)
declare @sm int
declare @m int
-- Print Report Heading
print 'id_no' + ' items'
print '----- ' + '------------------------------------------'
set @p = ''
-- set @m to the first id number
select top 1 @m = id_no from Example2
order by id_no
set @sm = 0
-- Process each id_no until no more items
while @m <> @sm
begin
set @sm = @m
-- string together all items with a comma between
select @i = id_no, @p = case when @p = '' then item else @p + ', ' + item end
from Example2 a
where id_no = @m
-- print id_no, and comma delimited string
print @i + ' ' + @p
-- increment id number
select top 1 @m = id_no from Example2
where id_no > @sm
order by id_no
set @p = ''
end
-- remove example table
drop table Example2


When I run this code against my Example2 table I get the following output:


id_no items
----- ------------------------------------------
1 Skiing, Diving
2 Diving, Skiing, Hunting, Fishing
4 Sailing, Skiing
5 Skiing


Let me explain how this code works. This code iteratively process each “id_no” value using a WHILE loop. Each pass through the WHILE loop strings together all the “item” values for a given “id_no”. The variable @m contains the value of the “id_no” for the records being collapsed into a single record. The following SELECT statement does all the work to collapse all the records for a given “id_no” value into a single row in the output:


select @i = id_no, @p = case when @p = '' then item else @p + ', ' + item end
from Example2 a
where id_no = @m


This code concatenates a comma with the value of the “item” column and adds it to the variable @p. This method allows you a way to summarize a character string, in this case the value of the “item” column followed by a comma. After this command has completed execution the variable @i contains the “id_no”, and the @p variable contains a comma delimited string of “item” column values for the give “id_no”.


The PRINT statement is used to display each row of comma delimited values for a given “id_no”. The last SELECT statement in the WHILE loop set the @m variable to the next “id_no” to be processed. This WHILE loop continues to creating comma delimited strings for each “item” column processing one “id_no” at a time until all “id_no” records have been processed.


Conclusion


This article showed you only two examples of how to deal with comma separated data. One example showed you how to break apart comma separated data, where as the other one showed you how to join multiple records into a single record where the data was separated by commas. Hopefully next time you have to deal with comma separated data these examples will give you a jump start on writing your T-SQL code to work with comma separated data.


http://www.databasejournal.com/features/mssql/article.php/3634381/Dealing-with-Comma-Delimited-Strings.htm

Calling a Web Service from within SQL Server

Posted on/at 12:08 AM by Admin


By Gregory A. Larsen

More and more shops are implementing web services. Doing this provides an architecture that allows applications to consume services to retrieve data. These services could be within your own organization or from a business partner. One of the problems you might run into when building applications that consume web services is how you can use web services data within a SQL Server instance. One of the reasons you might want to do this is so you can join a record set that is returned from a web service with one of your SQL Server tables. This can easily be done within an application, but how do you do this within a stored procedure that only runs within the context of SQL Server. In this article I will discuss one approach for doing this.

Using Web Services Data within SQL Server

If you need to write a T-SQL statement to join some web service information with a SQL Server table how might you go about doing this? Clearly, a web service is not a table or a view that allows you to easily join it with other compatible SQL Server objects. If you want to incorporate data from a web service into your server side logic like in a stored procedure, you need a method to call a web services directly from within SQL Server.

When Microsoft introduced SQL Server 2005, they implemented the CLR component. With a CLR, you can create a User Defined Function (UDF) that consumes a web service and returns a table, or sometimes referred to as a table value function. By using a UDF that calls a web service you are able to implement a solution that allows you to easily join a record set returned from a web service with a table or view. Using this methodology, you can now encapsulate a call to a web service within the code of a stored procedure.

Example of Building a CLR and a UDF to Consume a Web Service

For my example, I will be using the AdventureWorks database. I will be building a web service named “Product” to retrieve all the Production.Product data from the AdventureWorks database. This web service will be then be consumed by a UDF so I can join the information returned from this web service with the Sales.SalesOrderDetail table to display the Product Name information for each SalesOrderID.

First, let me show the code for my simple “Product” web services. Here is the C# sharp code for my web service:

using System;
using System.Web;
using System.Collections;
using System.Web.Services;
using System.Web.Services.Protocols;
using System.ComponentModel;
using System.Data;
using System.Data.SqlClient;
using System.Configuration;
namespace MyWebService
{
[WebService(Namespace = "MyWebSerice", Description = "Product")]
[WebServiceBinding(ConformsTo = WsiProfiles.BasicProfile1_1)]

public class wsProduct : System.Web.Services.WebService
{
[WebMethod(Description = "Returns all Products")]
public System.Data.DataSet GetProduct()
{
DataSet ds = new DataSet();
DataSet data = new DataSet();
SqlConnection conn = new SqlConnection();
conn = new SqlConnection(ConfigurationManager.ConnectionStrings["Product"].ConnectionString);
conn.Open();
SqlCommand cmd = new SqlCommand("SELECT ProductId, Name FROM Production.Product", conn);
// cmd.CommandType = CommandType.Text;
cmd.CommandType = CommandType.Text;
SqlDataAdapter adapter = new SqlDataAdapter();
try
{
adapter.SelectCommand = cmd;
}
catch
{
return null;
}
adapter.Fill(data, "Product");
return data;
}
}
}


This web service when called returns a record set that contains all the products in the Production.Product table. The record set returns a record set that only contains two columns: ProductId and Name.


Once my web service is up and running I can build my CLR. To build my CLR that calls the “Product” web service I will be using Visual Studio 2005. The first step in building my CLR is to create a new project. When I create my new project, I select the “SQL Server Project” template like so:


select the


Before I can create my UDF object, I need to add a web reference to my project for the “Product” web service. To do this I right click on “Web Reference” in the Solution Explorer and select the “Add Web Reference…” item. When I do this, the following screen is displayed:


right click on


On this screen, I enter the web address (URL) of my web service into the URL textbox, like so:


enter the web address (URL) of my web service into the URL textbox


Here you can see I entered “http://localhost/MyWebService/Product.asmx?WSDL. Once the address is typed, I click on the Go arrow. Doing this brings up the following window:


Add Web Reference


Here you can see it found my web server named “Product”. This web service only contains a single method named “GetProduct”. To finalize creating my web reference I will just need to change the “Web reference name” to something more appropriate than “localhost”. In my case, I enter “Product” in the “Web reference name” textbox and then click on the “Add Reference” button. This adds my “Product” web service as a web reference to my project.


The next step to building my solution is to create my UDF CLR object. To do this I use the Solution Explorer to add a new item. When I select the “Add New Item”, the following window is displayed:


create the UDF CLR object


Here I select the “User-Defined Function” template, and “Name” my UDF “GetProduct.cs”.


Here is the code for my CLR UDF:


using System;
using System.Collections;
using System.Data;
using System.Data.SqlClient;
using System.Data.SqlTypes;
using Microsoft.SqlServer.Server;
using System.Xml;
using UDF_CLR.Product;
public partial class UserDefinedFunctions
{
/*
* Author: Greg Larsen
* Description:
* This code creates a User Define Table Value Function that calls the GetProduct web service.
* This Function is CLR that needs to be defined in SQL Server before it can be used in a T-SQL
* Statement. Keep in mind when building this code the following
* post processing is required to create a XML serialized assembly:
* "C:\Program Files\Microsoft Visual Studio 8\SDK\v2.0\Bin\sgen.exe" /force "$(TargetPath)"
* Also a web reference called "Product" needs to be created that references:
* http://localhost/MyWebService/wsProduct.asmx?WSDL
*/
[SqlFunction(
DataAccess = DataAccessKind.Read,
FillRowMethodName = "GetProduct_FillRow",
// define columns returned
TableDefinition =
"ProductID int, " +
"Name ncharvar(50) "
)
]
public static IEnumerable GetProduct()
{
return new wsProduct().GetProduct().Tables[0].Rows;
}

public static void GetProduct_FillRow(
object ProductObj,
out SqlInt32 ProductID,
out SqlString Name
)
{
DataRow r = (DataRow)ProductObj;
ProductID = new SqlInt32(Convert.ToInt32(r["ProductID"].ToString()));
Name = new SqlString(r["Name"].ToString());
}
};


Let me walk through this code.


In this code, I first defined my UDF using SqlFunction attribute using the following code:


    [SqlFunction(
DataAccess = DataAccessKind.Read,
FillRowMethodName = "GetProduct_FillRow",
// define columns returned
TableDefinition =
"ProductID int, " +
"Name ncharvar(50) "
)
]


In this code snippet, I identified that my UDF will:


  • Be read only


  • Be populated using the “GetProduct_FillRow” method in my class


  • Define that there will only be two columns “ProductID” and “Name” in the table returned.


In the next section of code I create the “GetProduct() “IEnumerable” object. This code returns the data from my “wsProducts” web service one row at a time.


The last section of code in the above C# code shows the “GetProduct_FillRow” method. This method is used to populate my UDF record set from the wsProduct object returned from the “IEnumerable” object. In this section of code, I convert the data returned from my web service to the appropriate SQL Server data types for each column.


Once the code above is included in my Visual Studio project the next step is to build the solution to create the ddls for my CLR. When I was working though building my first UDF CLR object I found out the XML objects are not serialized. In order to serialize my CLR I had to perform some post-processing to incorporate the XMLSerialization object into my CLR solution. This is done by using the sgen executable. You can either setup your Visual Studio project to perform this post-processing every time you build your solution, or call this sgen executable manually. I set up my Visual Studio project to do this automatically.


It is easy to set up your Visual Studio project to automatically do the XML serialization via the post processing properties of a project. To do this with my project I right clicked on my project in the Solution Explorer window and then selected “Properties” from the drop down window. When the properties window displayed, I then clicked the “Build Event” tab item in the menus on the left. Doing that displayed the window below:


clicked the


In the “Post-build event command line:” item I enter the following code to execute the sgen executable:


"C:\Program Files\Microsoft Visual Studio 8\SDK\v2.0\Bin\sgen.exe" /force "$(TargetPath)"


At this point my project is all set up and ready to be built to create my CLR dlls using the “Build” menu item. During the build process, Visual Studio creates two dlls and places them in the “Output Path:” location identified under the “Build” properties of my solution. One dll is named UDF_CLR.dll, and the other is named UDF_CLR.Xmlserializer.dll. These are the two dlls I will need to incorporate into my SQL Server environment in order to get my UDF function to work.


To include both these two dlls into my SQL Server environment I first copy them to a drive on my SQL Server machine. For my example, I copied them to a directory named C:\CLR. Once my dlls are copied, I run the following T-SQL code on my SQL Server machine:


use AdventureWorks
go
-- allows you to create external access CLRs
ALTER DATABASE AdventureWorks SET TRUSTWORTHY ON;
GO

IF EXISTS (SELECT name FROM sysobjects WHERE name = 'GetProductWS')
DROP FUNCTION GetProductWS
go
IF EXISTS (SELECT [name] FROM sys.assemblies WHERE [name] = N'XmlSerializers')
DROP ASSEMBLY [XmlSerializers]
IF EXISTS (SELECT name FROM sys.assemblies WHERE name = 'GetProductCLR')
DROP ASSEMBLY GetProductCLR
GO

CREATE ASSEMBLY GetProductCLR FROM 'C:\CLR\UDF_CLR.dll'
WITH PERMISSION_SET = External_Access

CREATE ASSEMBLY [XmlSerializers] from
'C:\CLR\UDF_CLR.XmlSerializers.dll'
WITH permission_set = SAFE
GO

CREATE FUNCTION GetProductWS()

RETURNS TABLE (
ProductID int,
Name nvarchar(50)
)
AS EXTERNAL NAME GetProductCLR.UserDefinedFunctions.[GetProduct]
GO


As you can see this T-SQL code used two different “CREATE ASSEMBLY” statements to incorporate my dlls into SQL Server. The first one creates the CLR for my GetProductCLR object, and the other one to create the XmlSerializers CLR. After my assembly are created I then use the CREATE FUNCTION statement to create my GetProductWS user defined function. At this point, I am done setting up my CLR. All that is left is to test my user defined function to determine if it can successfully return the data from my GetProduct method of my wsProduct web service. To do that testing I run the following code:


SELECT * from db.GetProductWS();


This is basically all it takes to execute my UDF that call a web service. Now that I have my UDF GetProductWS, I can join the output from my web service to a SQL Server table by running some code like this:


SELECT B.SalesOrderID, A.Name [ProductName]
FROM dbo.GetProductWS() A
JOIN Sales.SalesOrderDetail B
ON A.ProductID = B.ProductID


Running code like this allows me to easily include data from by web service into a T-SQL script.


Incorporating a Web Service into a T-SQL Solution


With the proliferation of web services sooner or later you will find a need to join the output of a web service with a SQL Server table using T-SQL code. The example I showed you above created a UDF function to call a web service via a CLR and return that data as a table valued function. The output from a table valued function can then be joined to a SQL Server table quite easily. This method allows you a way to incorporate output from a web services into a T-SQL solution.


http://www.databasejournal.com/features/mssql/article.php/3821271/Calling-a-Web-Service-from-within-SQL-Server.htm

About Me

Developers house is a blog for posting technical articles in different technology like Microsft, Java, Oracle ..etc Microsoft technology includes c#,VB.net,ASP.net,Ajax,SilverLight,TFS,VS.NET 2003,2005,2008,2010 , SQL Server 2000, 2005 , Expression Blend , ...etc I hope it is helpful for all of you and if you are interested to post articles on it, only send me at ahmad.eed@gmail.com